
Sure, you know you can use PlantText to easily create awesome UML diagrams. But did you know you can also use it to help you visualize JSON?
In today’s data-centric world, JSON (JavaScript Object Notation) has become the go-to format for exchanging data between servers, web applications, and APIs. Whether you’re a software developer, data analyst or tester, chances are you’ve come across it before. Its lightweight structure makes it incredibly versatile and widely used across the web.
Although JSON is great for computer systems and technical folks, it can look like a confusing mess of curly braces and commas to non-technical team members. When dealing with large or complex data sets, JSON can become a jungle of nested objects, arrays, and key-value pairs that are difficult to grasp at a glance. This is where PlantText comes to the rescue with its nifty ability to visualize JSON, turning your tangled code into something human readable.
JSON is everywhere
Why the heck is JSON so ubiquitous anyway? Well, it’s become the de facto standard for data exchange for several good reasons:
- Simplicity: Its syntax is simple and easy to understand. With key-value pairs and arrays, it closely resembles how data is structured in many programming languages, making it natural for developers.
- Interoperability: JSON is language agnostic. It can be easily parsed whether you’re working with JavaScript, Python, Java, or pretty much any programming language. This interoperability makes it the perfect medium for sharing data between systems with different tech stacks.
- Efficiency: It’s lightweight, making it ideal for transmitting data over the web. It doesn’t come with the overhead of heavier formats like XML.
The challenges of working with JSON
While JSON is great for machines, humans (especially non-technical humans) often struggle with it. Here’s why working with JSON can sometimes be a pain:
- Not super readable: For small datasets, JSON is easy enough to skim through. But as soon as you start working with deeply nested structures or arrays with dozens of elements, it can quickly become unreadable to the untrained eye. A large JSON document can easily look like a tangle of curly braces and commas, making it hard to spot patterns or even understand what’s going on.
- Not ideal for collaboration: If you’ve ever had to explain JSON to someone who isn’t a developer, you know the pain. Non-technical stakeholders might find it difficult to understand, which can make collaboration more challenging.
- Error-prone: A missing comma here or an extra curly brace there can lead to parsing errors. If your dataset is complex, it can be frustrating to debug.
How to visualize JSON in PlantText
Are you ready for this? Because if you blink you’ll miss it. Copy. Paste. Done! Using PlantText to visualize JSON is incredibly simple:
- Change the start & end tags. Instead of @startuml and @enduml, begin your diagram with @startjson and end it with @endjson.
- Copy & paste. Copy the JSON you want to visualize. This could be anything from an API response, a configuration file, or a data structure you’re working on. And then paste it right into the PlantText editor between the @startjson and @endjson tags. PlantText will instantly generate a visual diagram that represents the structure of your JSON.
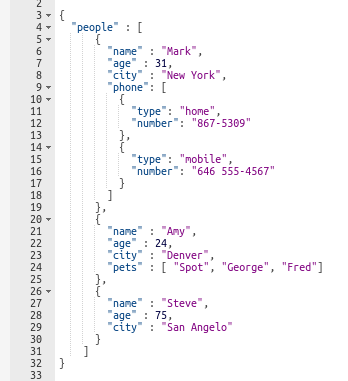
Bam! The end! It’s that easy. Here’s the above JSON rendered visually.
Now you can see the different elements and get a clearer picture of how things are related to each other. And if you need to share your diagram, PlantText makes it simple. Just save as .png or .svg. Or right click “Share” to get a shareable link.
Working with samples
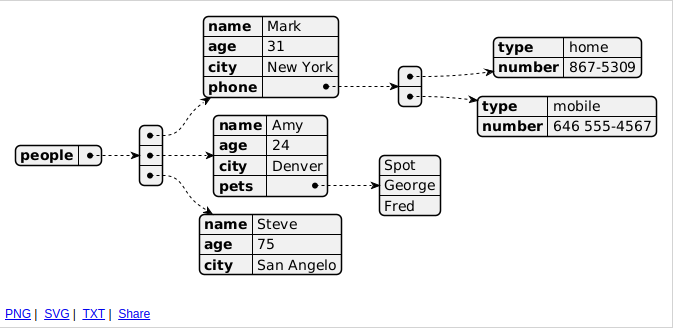
To make your life even easier, PlantText gives you a head start in working with JSON by providing seven different sample diagrams. Open the Samples window, choose JSON in the Sample type dropdown, and then take your pick.
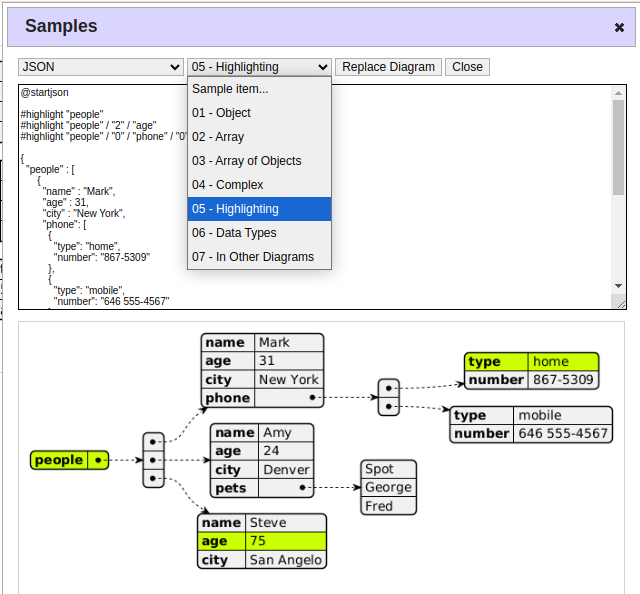
You can even see an example of how to embed JSON structures within other UML diagrams!
Here’s an example
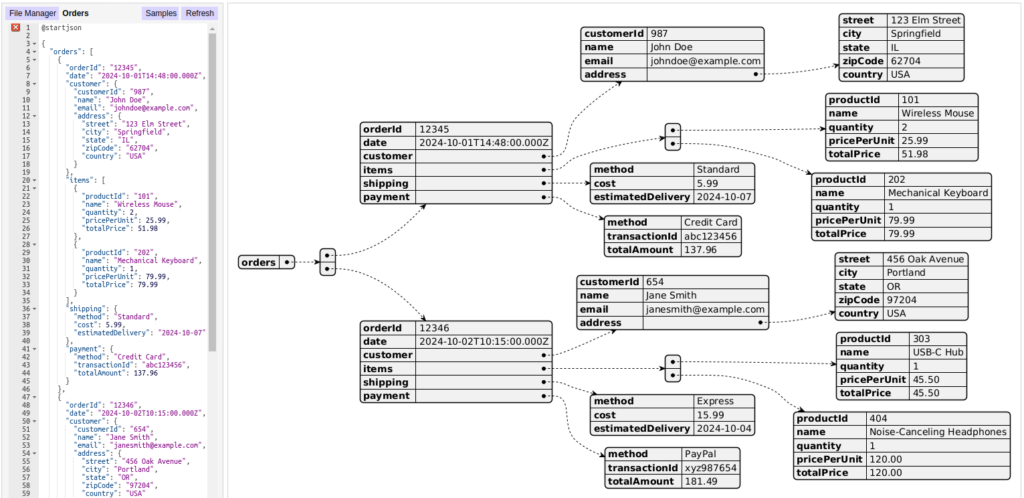
Let’s say we run an e-commerce website, and we have JSON that contains order information, including customers, items, and payment details. Pasting that data between the start and end tags instantly yields this diagram:
If you’re sitting down with someone in customer support or testing, trying to understand some small detail buried in the JSON, being able to visualize it like this can be invaluable. Even better than generating the diagram and sharing it with your team, send your support person or tester to PlantText, and have them generate the diagram themselves!
Conclusion
JSON is a fantastic format for exchanging data, but it isn’t always the easiest to work with, especially for non-technical users. That’s where PlantText shines. By converting JSON into visual diagrams, it turns a potentially confusing mass of code into something that’s easy to understand, communicate, and collaborate on.
Whether you’re working on a small project or managing complex data exchanges, using PlantText to visualize JSON can save you time, reduce errors, and improve communication across your team. So, next time you find yourself buried in a JSON jungle, remember that PlantText has your back, ready to turn that tangle of data into something you can actually see and work with.