Activity diagrams are a type of UML (Unified Modeling Language) diagram that’s used to model workflows and illustrate the steps in a system or a process. They can help you visualize complex sequences in a simple, intuitive way and are often used in software development, business processes, and systems engineering to show the flow of control or steps in a process.

In my experience building custom software, they have been essential for documenting a client’s business processes. For example, capturing how a client is manually processing HR approval forms on paper. And they are equally indispensable later for constructing new and improved workflows for the automated system under construction. They can even help communicate with developers because Activity Diagrams already contain the logic to be coded…conditionals, while loops, etc.
Let’s take a closer look at what activity diagrams are, how they work, and how to use them to provide clarity in your projects.
What Is an Activity Diagram?
An activity diagram is essentially a flowchart that describes steps within a process. They capture the flow of activities or operations, decisions, and transitions. They can depict both sequential and concurrent tasks. Activity diagrams are especially suited to representing complex workflows with multiple paths, decision points, and actors.
You’ll notice that activity diagrams have start and end nodes to show the beginning and end of the process. They include a variety of actions, or steps in the process. These steps may be parallel or in sequence. They may also make use of conditionals: if this, then that, else some other thing. Some of the most common symbols you’ll see in an activity diagram include:
- Initial State: A solid black circle, showing where the process begins.
- Activity: A rounded rectangle that describes a specific task or operation.
- Decision Node: A diamond shape, where the flow branches based on conditions (like yes/ no).
- Merge Node: Also a diamond shape but without conditions, where multiple paths converge back into one.
- Fork Node and Join Node: Illustrate parallel processes, where multiple activities can occur simultaneously (fork), and then converge back into a single flow (join).
- Final State: A solid black circle within a larger circle, indicating where the process ends.
Why Use Activity Diagrams?
Activity diagrams can be used not only for building custom software, but also for business analysis and business process improvement. Diagramming a business process – and seeing just how crazy and inefficient it is – is your first step toward finding a better way. The other thing that’s great about activity diagrams is that they can speak to a broad audience – clients, stakeholders, developers, project managers – on how different parts of a business process are interrelated.
- Clarity: When you’re dealing with a process that has many steps or branches, an activity diagram makes it easier to visualize how each part of the workflow fits together.
- Collaboration: Team members from different departments can quickly grasp the process flow.
- Identifying bottlenecks and redundancies: Because activity diagrams highlight each step and decision point, they’re excellent tools for identifying bottlenecks and duplicate steps.
- Considering different scenarios: Using decision and merge nodes, activity diagrams make it easy to look at different outcomes, helping you plan for various scenarios.
How to Create Activity Diagrams in PlantText
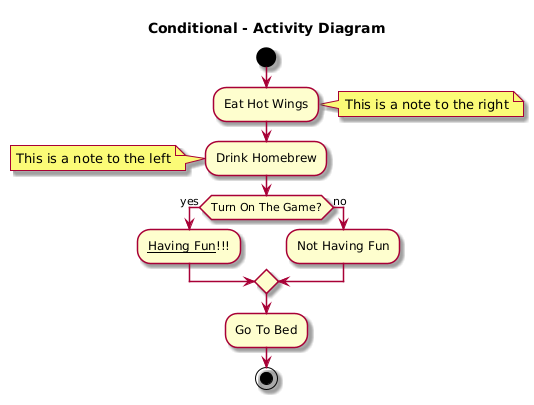
PlantText of course provides a handful of different sample activity diagrams to get you started. They are lighthearted – ok maybe a bit silly – but each one highlights a different element of activity diagrams, to help you understand just the piece you’re looking for. For example, this one shows a basic conditional.

@startuml
skin rose
title Conditional - Activity Diagram
start
:Eat Hot Wings;
note right: This is a note to the right

:Drink Homebrew;
note left: This is a note to the left

if (Turn On The Game?) then (yes)
  :__Having Fun__!!!;
else (no)
  :Not Having Fun;
endif

:Go To Bed;
stop
@enduml
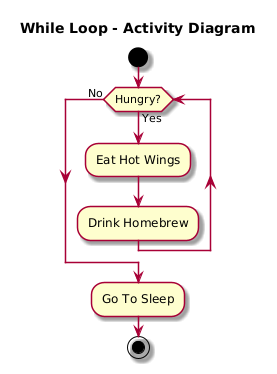
This one shows a simple while loop:

@startuml
skin rose
title While Loop - Activity Diagram
start

while (Hungry?)  is (Yes)
  :Eat Hot Wings;
  :Drink Homebrew;
endwhile (No)

:Go To Sleep;
stop
@enduml
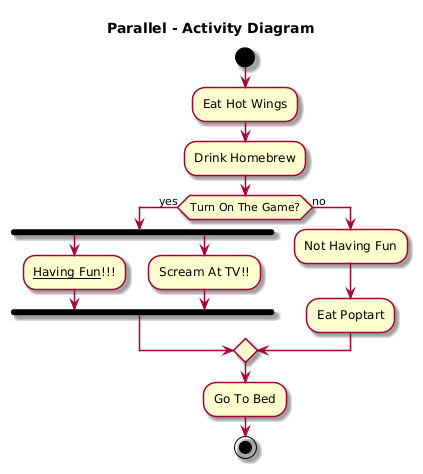
And this one shows a parallel process.

@startuml
skin rose
title Parallel - Activity Diagram
start

:Eat Hot Wings;
:Drink Homebrew;

if (Turn On The Game?) then (yes)
  fork
    :__Having Fun__!!!;
  fork again
    :Scream At TV!!;
  end fork
else (no)
  :Not Having Fun;
  :Eat Poptart;
endif

:Go To Bed;
stop
@enduml
Putting It All Together
Now let’s put together these elements into a real-world example. (Not that beer and hot wings don’t exist in the real world.)
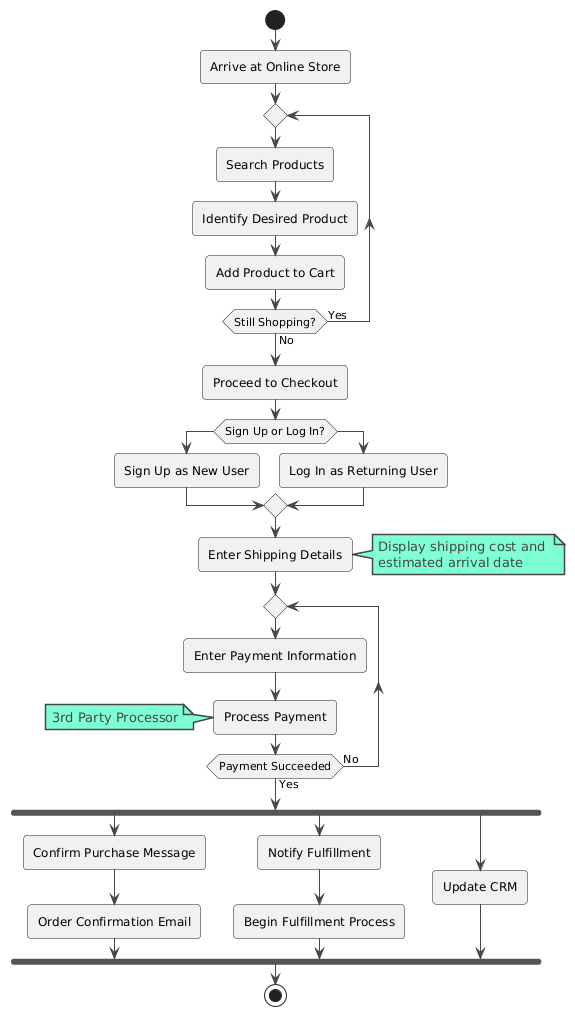
Here is an activity diagram describing the purchase process at an e-Commerce web site. We see a couple of repeats, a conditional and some notes. We also see several activities kicking off in parallel once the purchase goes through.

Here’s the plantUML for that diagram:
@startuml
!theme vibrant
start
:Arrive at Online Store;

repeat
  :Search Products;
  :Identify Desired Product;
  :Add Product to Cart;
repeat while (Still Shopping?)  is (Yes) not (No)

:Proceed to Checkout;

if (Sign Up or Log In?) then
  :Sign Up as New User;
else
  :Log In as Returning User;
endif

:Enter Shipping Details;
note right
  Display shipping cost and
  estimated arrival date
end note

repeat
  :Enter Payment Information;
  :Process Payment;
  note left: 3rd Party Processor
repeat while (Payment Succeeded) is (No) not (Yes)

fork
  :Confirm Purchase Message;
  :Order Confirmation Email;
fork again
  :Notify Fulfillment;
  :Begin Fulfillment Process;
fork again
  :Update CRM;
end fork

stop
@enduml
And this only scratches the surface of what’s possible in an activity diagram. Give it a try yourself over at planttext.com. Or for more on activity diagram syntax in PlantUML, go here.
Wrapping Up
Activity diagrams are incredibly useful for anyone who needs to capture, analyze, or explain complex workflows. By showing each action and decision in sequence, they enhance communication among team members and can identify opportunities to streamline processes. Whether you’re building software or refining a business process, activity diagrams can clarify workflows to ensure that every step is accounted for.
Want more UML diagrams? Feel free to explore the other posts in our UML Diagrams series.
